Usage Management: Viewing Usage Information
You can view usage information in the Producer Portal. Recall that your product must have a usage model set for usage information to be shown in the usage graphs and gauges, as described in Usage Management: Creating Products.
Under the Usage menu, select Usage Search. In the Usage Search screen, enter the name of your metered feature—survey—in the Meter Name field and then click Search. Click the desired account from the list of results to see usage reports for that account. For these exercises, choose the customer account you created earlier: DemoCustOrg.
The captured usage information is then rendered on the Usage Search page. By default, the usage information is displayed as a gauge showing the percentage of the usage count compared to the entitled count. The label for the gauge shows the text you entered for the feature description, if any. The value you entered for Units on the Create a Feature page—in this case, Measurements—appears as the label for the usage count. In practice, this might be Downloads or Gigabytes or whatever usage you are tracking.
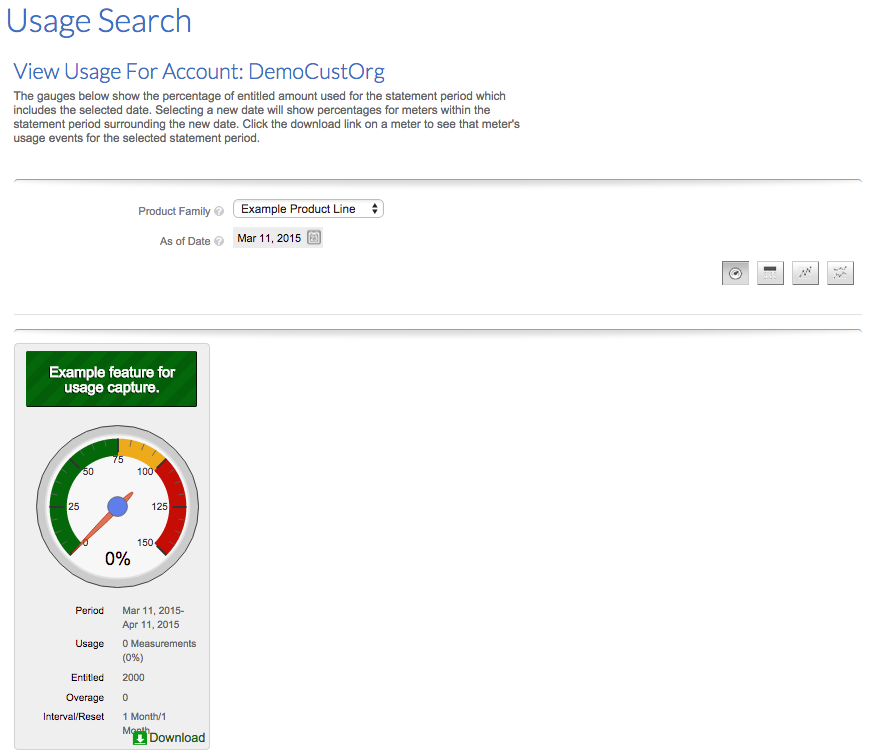
Example usage gauge for the survey feature
In the View Usage page, you can view the captured usage information as different types of graphs, or download the usage information for analysis. With the graph buttons, you can display usage information as a gauge, a textual table of usage information, a graphical timeline, or a graphical timeline comparing multiple metrics.
Note:Unless you have a client that is already reporting usage data, expect the usage reports to show 0 usage.
Similarly, a user in the enterprise customer account can view current usage information by logging in to the End-User Portal and viewing usage reports.